ESSEX PROPERTY TRUST (ESS)·Q4 2025 Earnings Summary
Essex Property Trust Delivers Strong Q4 as Same-Property Growth Accelerates to 3.8%
February 05, 2026 · by Fintool AI Agent
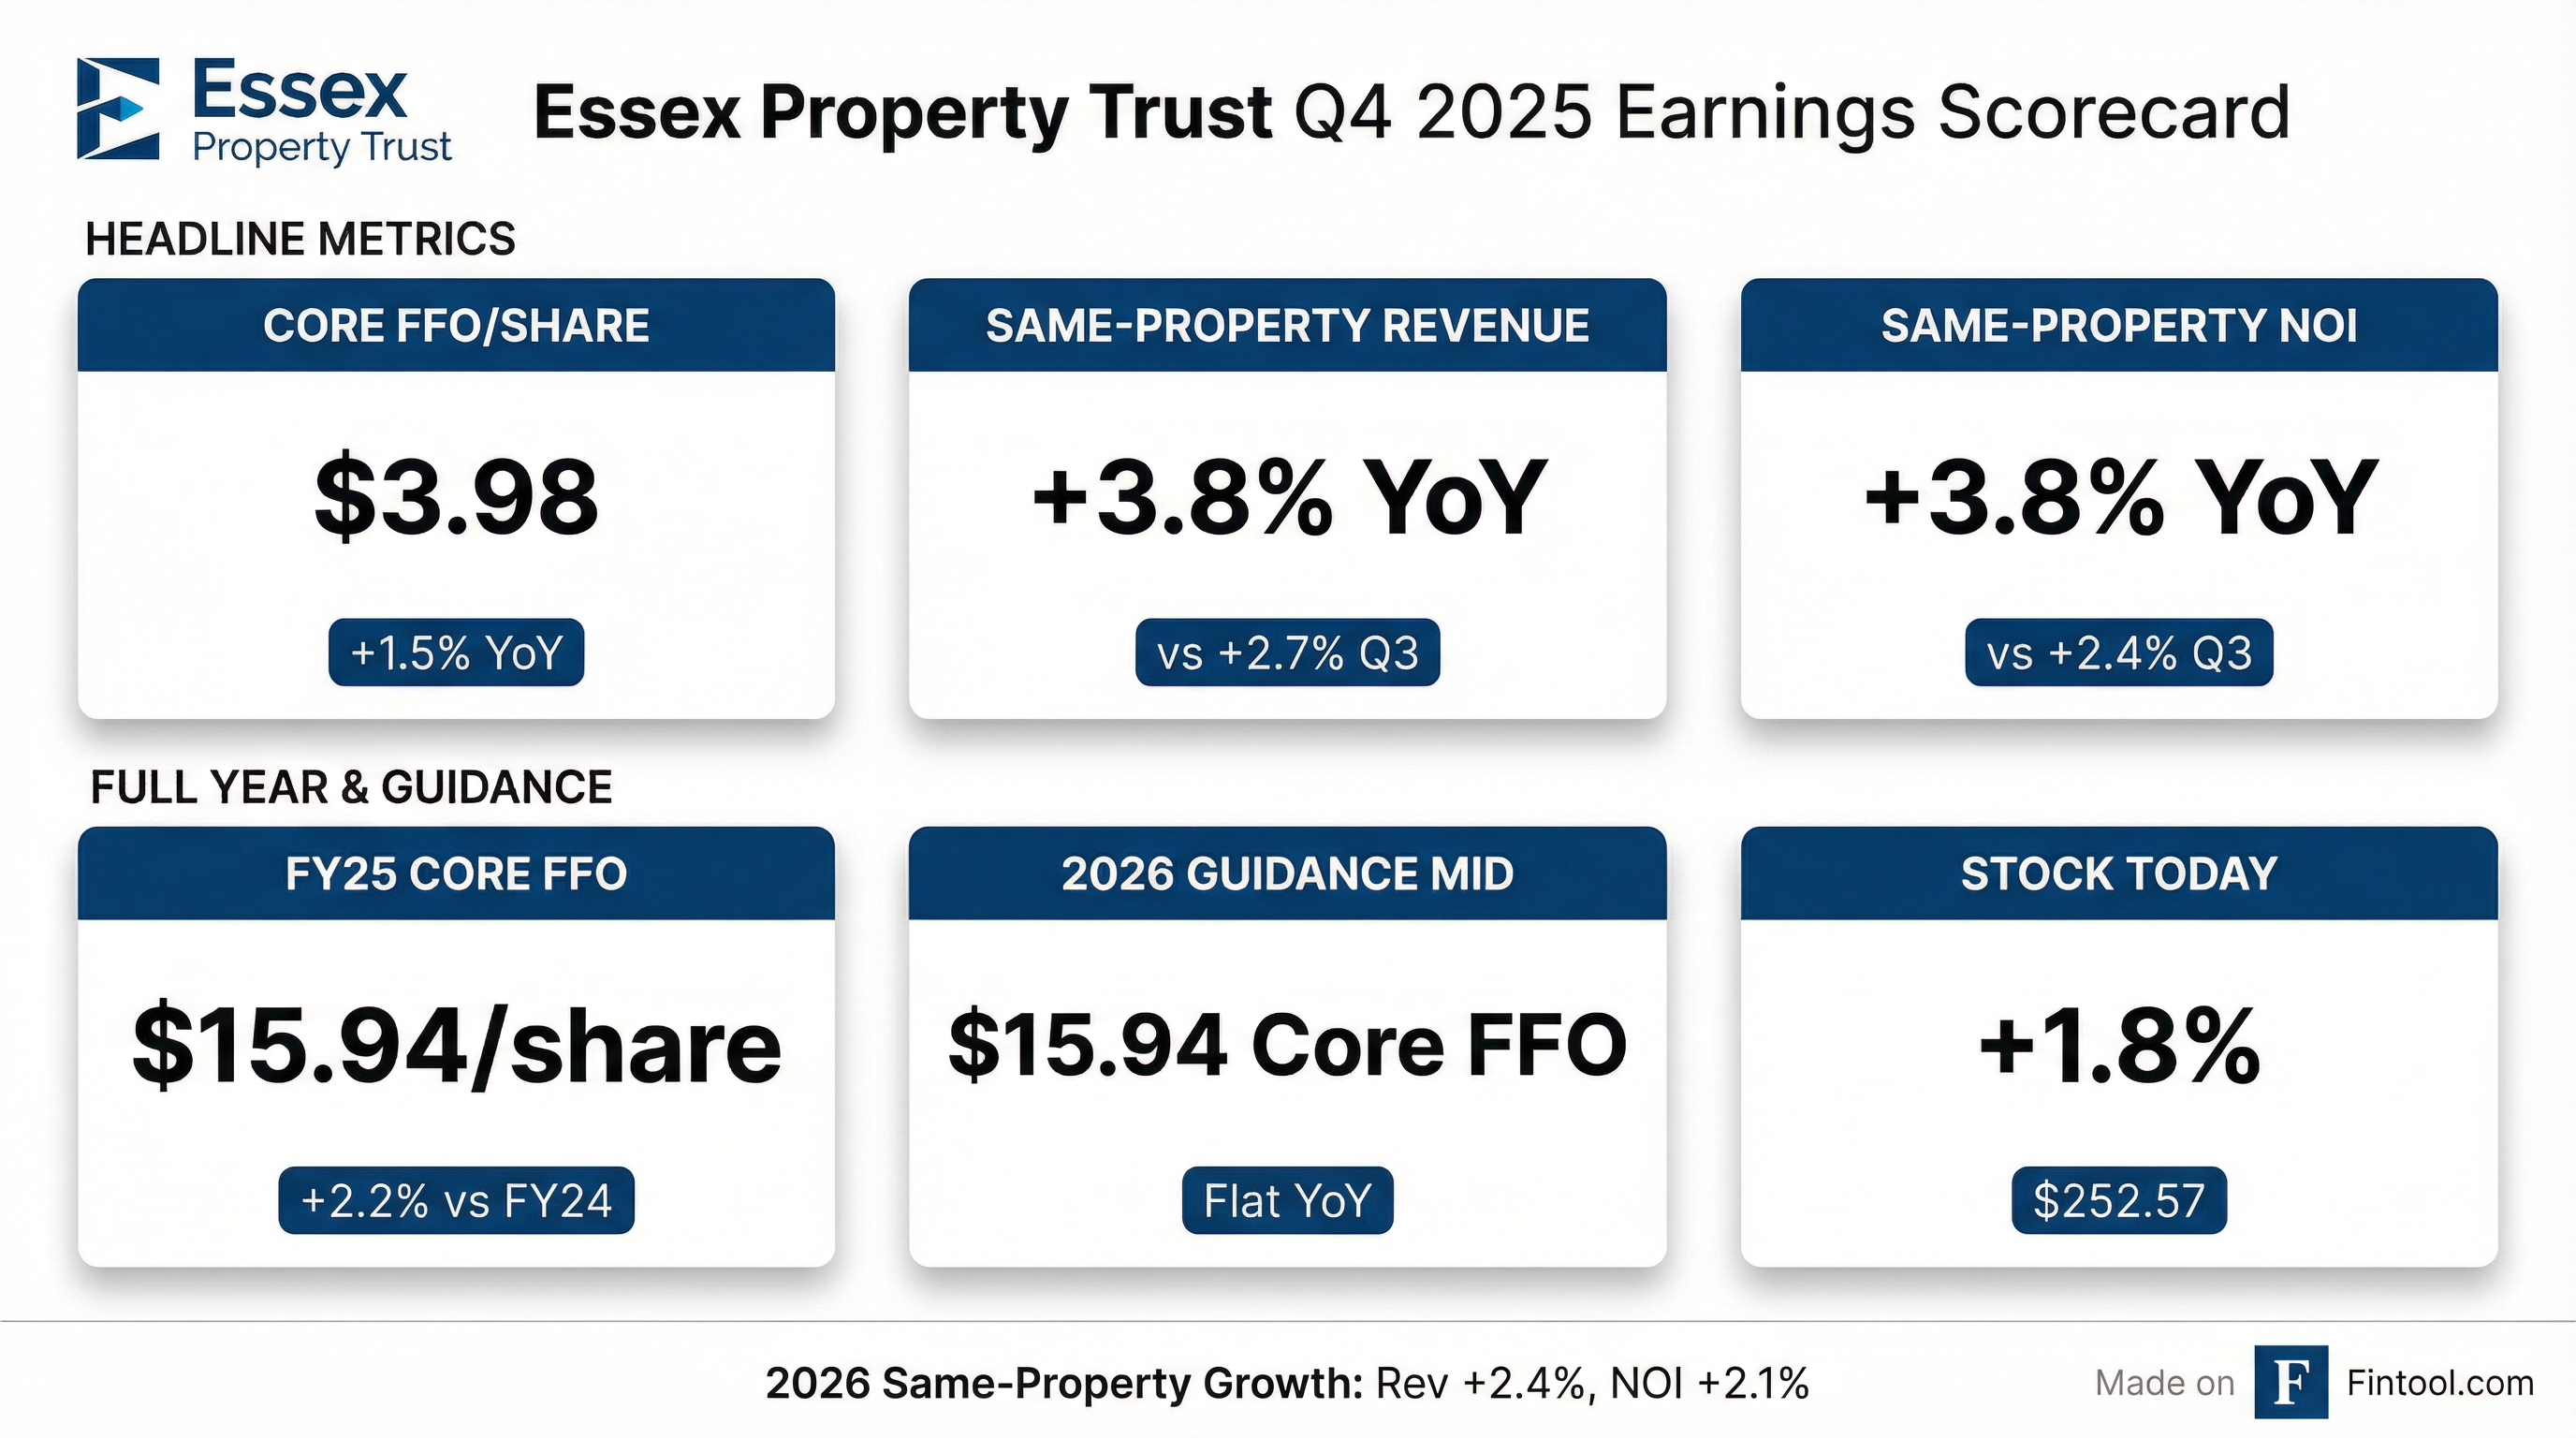
Essex Property Trust (NYSE: ESS) reported Q4 2025 results that exceeded management's guidance, with same-property performance accelerating significantly in the final quarter of the year. Core FFO per share grew 1.5% year-over-year to $3.98, while same-property revenue and NOI both increased 3.8% — a notable acceleration from prior quarters .
The West Coast apartment REIT finished 2025 with full-year Core FFO of $15.94 per share, exceeding the midpoint of original guidance and representing 2.2% growth versus 2024 . However, 2026 guidance suggests flat Core FFO growth at the midpoint, though management notes that excluding structured finance headwinds, underlying growth would be 1.8% .
Did Essex Beat Earnings?
Core FFO: Essex delivered Core FFO of $3.98 per share, growing 1.5% year-over-year and consistent with full-year performance .
Same-Property Performance: The standout metric was same-property growth, which accelerated materially in Q4:
Net Income: Net income per diluted share was $1.25 in Q4 2025, down sharply from $4.00 in Q4 2024. This decline was driven by gains on sale of real estate and gains on remeasurement of co-investments in the prior year period rather than operational weakness .
Full-Year 2025 Performance:
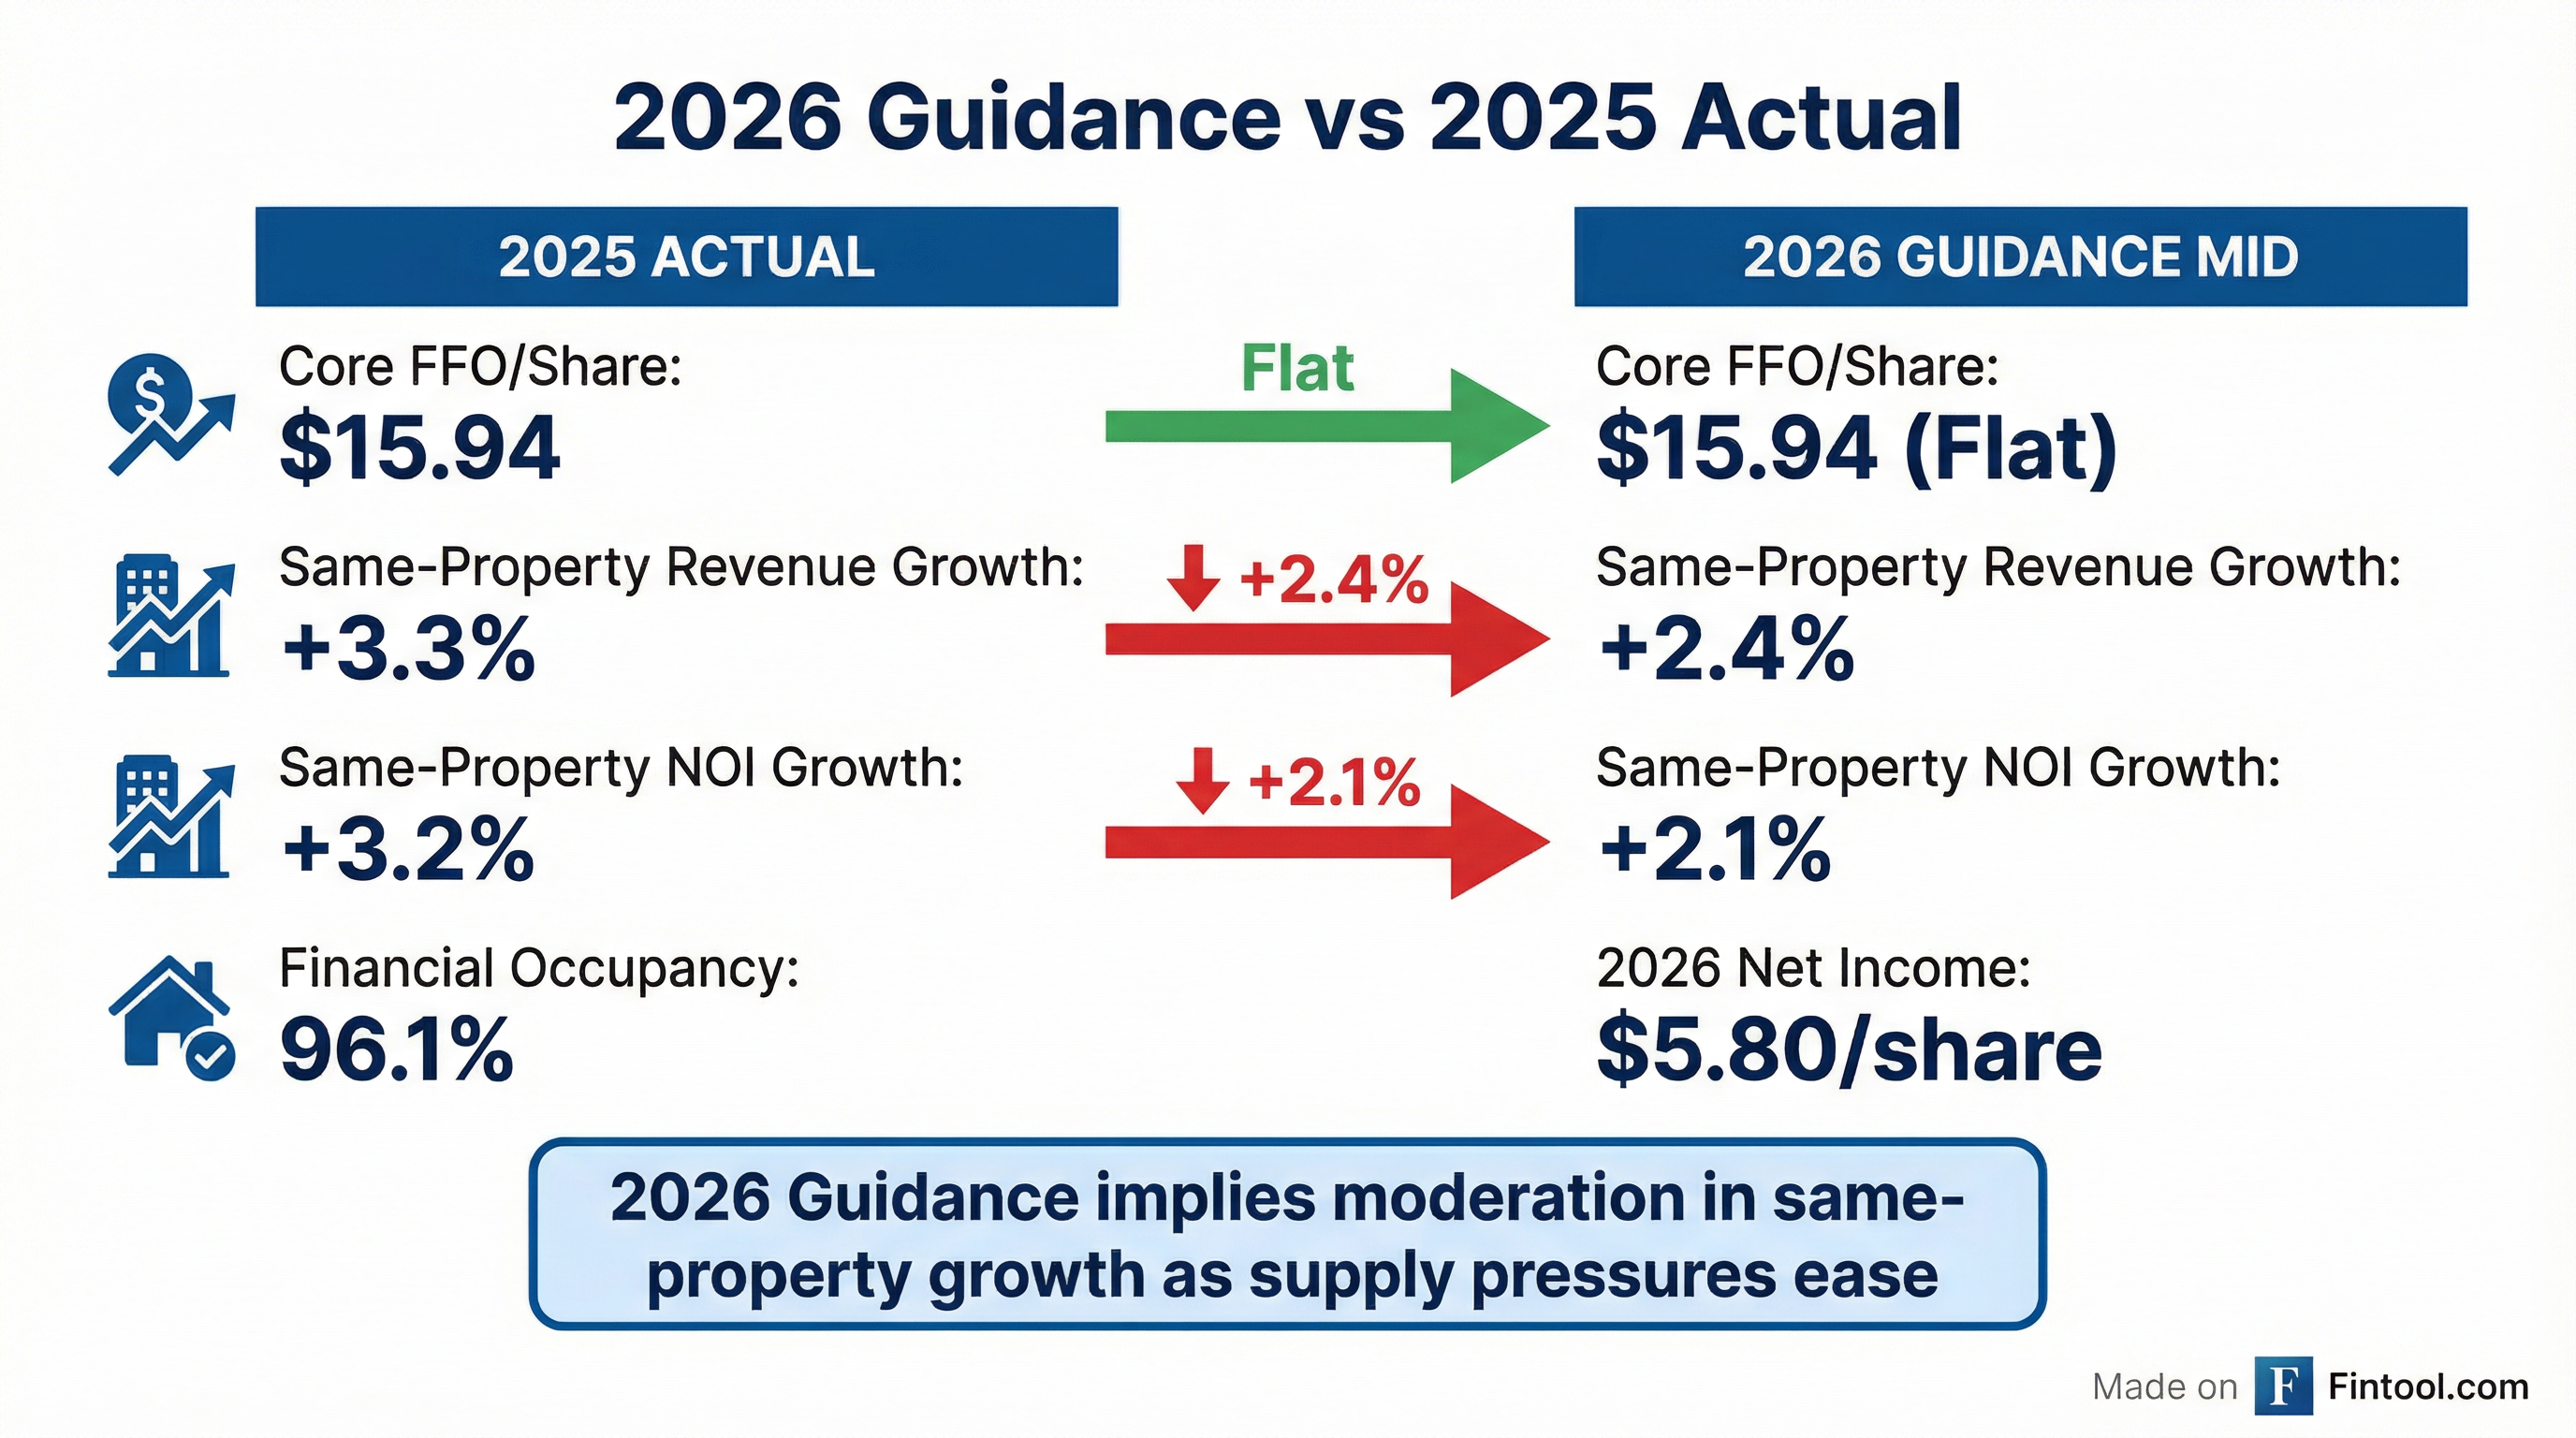
- Same-property revenue: +3.3% (exceeded guidance midpoint)
- Same-property NOI: +3.2% (exceeded guidance midpoint)
- Core FFO: $15.94/share (+2.2% YoY)
What Did Management Guide for 2026?
Essex provided 2026 guidance that implies a more challenging operating environment:
Key Takeaways:
- Core FFO flat at midpoint: 2026 guidance of $15.94 midpoint implies no growth versus 2025
- Structured finance headwinds: Excluding the ~$0.29 FFO impact (net of reinvestment) from structured finance redemptions, Core FFO would be $16.23 (+1.8% YoY growth)
- Same-property deceleration: Revenue growth moderating from 3.3% to 2.4% at midpoint
- NOI compression: Same-property NOI expected to slow from 3.2% to 2.1% as expense growth outpaces revenue
- Net income decline: The sharp drop in guided net income reflects absence of prior-year asset sale gains
Regional Same-Property Performance
Northern California outperformed in Q4, led by Santa Clara and San Mateo counties:
Net Effective Rent Growth (Q4 2025) :
- New leases: -2.4% (improvement from prior quarters)
- Renewals: +4.8%
- Blended: +1.9%
What Changed From Last Quarter?
Positive Developments:
- Same-property growth accelerated from 2.7% (Q3) to 3.8% (Q4) on both revenue and NOI
- Full-year 2025 results exceeded original guidance midpoints
- Financial occupancy improved 40 bps YoY to 96.3%
- Issued $350M of 10-year senior unsecured notes at 4.875%, demonstrating capital markets access
- Liquidity exceeds $1.7 billion
Areas of Concern:
- 2026 guidance implies no Core FFO growth at midpoint
- Same-property revenue and NOI growth expected to decelerate meaningfully
- Stock has underperformed, down 12% over the past year
Capital Allocation Highlights
Essex remained active on the capital allocation front in 2025:
Q4 2025 Acquisition: In November, the Company acquired 1250 Lakeside, a 250-unit community built in 2021 in Sunnyvale, CA for $143.5M ($574K/unit) .
Debt Activity: Issued $350M of 10-year senior unsecured notes at 4.875% coupon (4.988% YTM) to refinance April 2026 maturities .
How Did the Stock React?
ESS shares rose +1.8% on February 4 following the earnings release, closing at $252.57. On the earnings call day (February 5), shares traded slightly lower, closing at $251.97 (-0.2%).
*Values retrieved from S&P Global
The stock trades 20% below its 52-week high and 6% below its 200-day moving average, reflecting sector-wide pressure on apartment REITs from elevated interest rates. The muted post-call reaction suggests the Q&A largely confirmed expectations — no major surprises from management's 2026 outlook.
Balance Sheet & Credit Profile
Essex maintains investment-grade credit ratings and strong liquidity:
Credit Ratings: Moody's Baa1 (Stable) / S&P BBB+ (Stable)
Liquidity: Over $1.7 billion via undrawn capacity on credit facilities, cash, and marketable securities
Debt Maturities: 8% of debt matures in 2026, with $450M senior notes due April 2026 to be repaid with December 2025 bond proceeds
2026 Supply Outlook
A key tailwind for 2026: West Coast multifamily supply is projected to decline sharply:
Total supply as a percentage of stock is expected to decline from 0.5% to 0.4% across Essex markets .
Development Pipeline
Essex has one active development project:
The company expects ~$80M in development funding for 2026 and does not plan to start any new developments .
Forward Catalysts
Potential Upside:
- Supply declining 19% across West Coast markets in 2026, with Seattle down 30% and Northern California down 35%
- VC funding surge — Q4 VC funding at highest level in 4+ years, up 91% QoQ with 65%+ in Bay Area
- Return-to-office tailwinds from Amazon (January enforcement) and Microsoft (Q1 2026)
- Positive office absorption in all three northern markets for first time post-COVID
- LA nearing stabilization at 94.7% economic occupancy, approaching 95% threshold
- Transaction market improving — $12.6B in institutional multifamily volume in 2025, +43% YoY
Key Risks:
- Flat Core FFO guidance at midpoint implies no growth in 2026
- Job market uncertainty — Management notes "global uncertainty continues to weigh on the economy and job growth"
- Seattle tech layoffs — Several corporate announcements impacted Q4 demand
- Structured finance drag — 1.8% FFO headwind from redemptions
- Eviction processing delays in LA extending delinquency recovery timeline
- Midterm elections in H2 2026 could drive policy uncertainty
Key Q&A Highlights from the Earnings Call
Northern California Recovery
CEO Angela Kleiman highlighted strong momentum in Northern California, noting that VC funding in Q4 reached its highest level in over four years, up 91% quarter-over-quarter with over 65% flowing to the Bay Area . The company is seeing positive office absorption for the first time across all three northern markets — San Francisco, San Jose, and Seattle .
"Northern California is in a very interesting position at this point in time because we had talked about the potential recovery, and it's finally starting to take hold. So it's an exciting time for us from that perspective." — Angela Kleiman, CEO
Seattle Dynamics: Layoffs vs Return-to-Office
Management acknowledged Q4 softness in Seattle due to corporate layoff announcements but remains constructive on 2026. Key tailwinds include:
- 30% supply reduction in Seattle
- Amazon return-to-office enforcement began in January
- Microsoft return-to-office starting in Q1
- OpenAI quadrupled its Seattle office space
On the layoff impact, management noted: "Employees typically make their housing decisions 45 days in advance of a job change event. Our view is that the bulk of that layoff impact already has been felt in the fourth quarter and some spillover in January."
Los Angeles Path to Stabilization
LA's economic occupancy reached 94.7% in Q4, closing in on the 95% stabilization threshold . Supply is expected to decrease 20% in this market in 2026 . The remaining hurdle is eviction processing timelines, which remain slightly elevated versus pre-COVID averages .
Capital Allocation: Buybacks "Close Tie" with Acquisitions
When asked about buybacks versus acquisitions at current stock prices (~$255), CEO Kleiman emphasized that all options are on the table:
"Based on the stock today... it's kind of a close tie across the board. And so we need to look at how do we create value for the company. When we directed capital deployment for fee simple properties in Northern California over the past year and a half, it's done well for us... those assets ended up generating portfolio-leading rent growth with cap rate compression." — Angela Kleiman
Transaction Market: Cap Rates in 4-5% Range
SVP Rylan Burns provided color on buyer cap rates:
- Highly sought-after submarkets (⅓ of volume): Low 4% range
- Remaining markets (⅔ of volume): Mid-4% range
- Southern California transactions: 4.5-4.75% range
Total non-portfolio institutional multifamily transactions in Essex markets reached $12.6 billion in 2025, up 43% year-over-year .
Development Yields Required
On development starts, Rylan Burns noted: "In Northern California, where the transaction market feels like it's shaking in a 4.25 type range, something close to a 6%, I think, would definitely be worth the risk." No new development starts are planned for 2026 .
Structured Finance Headwind Details
CFO Barb Pak clarified that 90% of 2026 expected redemptions are tied to just 2 assets, with one having stopped accrual in Q4 after a third-party valuation. The guidance assumes no redemption proceeds from these assets — "There will and could be upside, but we don't know until we get further along in our discussions."
Going forward, the structured finance book is expected to be more stable. Year-end book value was $330 million, but only $175 million is generating income in 2026, with a 3-year maturity .
Blended Rent Growth Expectations
Management guided blended lease rate growth of 2.5% at midpoint for 2026, similar to 2025 :
- New leases: Flat to +2%
- Renewals: +3% to +4%
- February/March renewals running at mid-4%
Essex Property Trust is an S&P 500 REIT that acquires, develops, and manages multifamily residential properties in West Coast markets. The company owns interests in 259 apartment communities comprising over 63,000 apartment homes with an additional property in active development.
Related: ESS Company Profile | ESS Transcripts | Q3 2025 Earnings